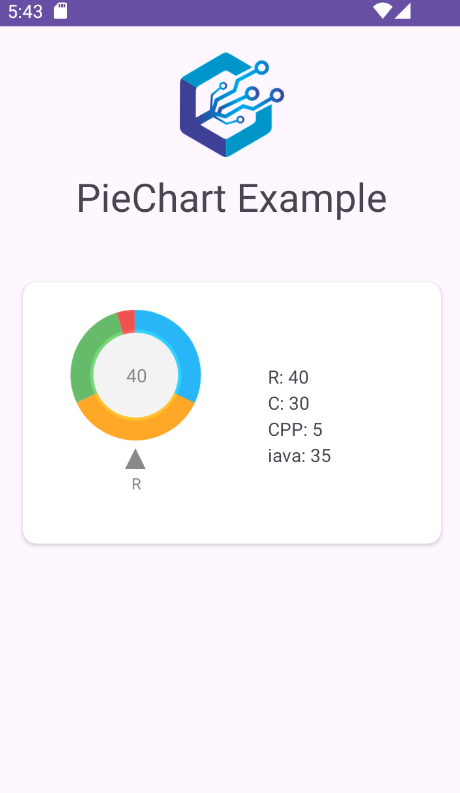
Pie chart is a circular statistical graphic, which is divided in slices of numerical data.Also referred to as a circle graph, a circular chart is divided into segments that represent relative frequencies or magnitude using radii.In a pie chart, numbers are shown as percentages, and the total of each segment's sum must equal 100%.let’s task one example of pie chart of the mobile application.
Syntax
- Below code write in .xml file
 <org.eazegraph.lib.charts.PieChart
    xmlns:app="http://schemas.android.com/apk/res-auto"
    android:id="@+id/piechart"
    android:layout_width="0dp"
    android:layout_height="match_parent"
    android:padding="6dp"
    android:layout_weight="1"
    android:layout_marginTop="15dp"
    android:layout_marginLeft="15dp"
    android:layout_marginBottom="15dp"

    />
- Below code write in .java file
    pieChart.addPieSlice(
            new PieModel(
                    "R",
                    Integer.parseInt("40"),
                    Color.parseColor("#FFA726")));
    pieChart.addPieSlice(
            new PieModel(
                    "C",
                    Integer.parseInt("30"),
                    Color.parseColor("#66BB6A")));
    pieChart.addPieSlice(
            new PieModel(
                    "C++",
                    Integer.parseInt("5"),
                    Color.parseColor("#EF5350")));
    pieChart.addPieSlice(
            new PieModel(
                    "Java",
                    Integer.parseInt("35"),
                    Color.parseColor("#29B6F6")));
    pieChart.startAnimation();
Step 1: Create a new project in Android or you can use an already created project.

Step 2: Create an activity_main.xml file in your layout folder . path (res>layout)
implement the same invoke the following code inside activity_main.xml file.
<?xml version="1.0" encoding="utf-8"?>
 <androidx.constraintlayout.widget.ConstraintLayout xmlns:android="http://schemas.android.com/apk/res/android"
    xmlns:app="http://schemas.android.com/apk/res-auto"
    xmlns:tools="http://schemas.android.com/tools"
    android:id="@+id/idRLContainer"
    android:layout_width="match_parent"
    android:layout_height="match_parent"
    android:orientation="vertical"
    tools:context=".MainActivity">
    <RelativeLayout
        android:layout_width="match_parent"
        android:layout_height="match_parent"
        tools:context=".MainActivity">
        <ImageView
           android:id="@+id/imgPiechart"
            android:layout_centerHorizontal="true"
            android:layout_width="80dp"
            android:src="@drawable/company_logo"
            android:layout_marginTop="20dp"
            android:layout_height="80dp"/>
        <TextView
            android:layout_width="wrap_content"
            android:text="PieChart Example"
            android:textSize="30dp"
            android:layout_marginTop="10dp"
            android:layout_below="@+id/imgPiechart"
            android:layout_centerHorizontal="true"
            android:layout_height="wrap_content"/>
        <androidx.cardview.widget.CardView
            android:id="@+id/cardViewGraph"
            android:layout_centerInParent="true"
            android:layout_width="match_parent"
            android:layout_height="200dp"
            android:layout_marginLeft="20dp"
            android:layout_marginRight="20dp"
            android:layout_marginTop="15dp"
            android:elevation="10dp"
            app:cardCornerRadius="10dp">
            <LinearLayout
                android:layout_width="match_parent"
                android:layout_height="match_parent"
                android:orientation="horizontal"
                android:weightSum="2">

                <org.eazegraph.lib.charts.PieChart
                    xmlns:app="http://schemas.android.com/apk/res-auto"
                    android:id="@+id/piechart"
                    android:layout_width="0dp"
                    android:layout_height="match_parent"
                    android:padding="6dp"
                    android:layout_weight="1"
                    android:layout_marginTop="15dp"
                    android:layout_marginLeft="15dp"
                    android:layout_marginBottom="15dp"

                    />


                <LinearLayout
                    android:layout_width="0dp"
                    android:layout_height="match_parent"
                    android:layout_weight="1"
                    android:layout_marginLeft="20dp"
                    android:orientation="vertical"
                    android:gravity="center_vertical"
                    >

                    <LinearLayout
                        android:layout_width="match_parent"
                        android:layout_height="15dp"
                        android:layout_gravity="center_vertical">

                        <TextView
                            android:id="@+id/txtR"
                            android:layout_width="wrap_content"
                            android:layout_height="wrap_content"
                            android:text="R"
                            android:paddingLeft="10dp"/>

                    </LinearLayout>

                    <LinearLayout
                        android:layout_width="match_parent"
                        android:layout_height="15dp"
                        android:layout_gravity="center_vertical"
                        android:layout_marginTop="5dp">


                        <TextView
                            android:id="@+id/tvPython"
                            android:layout_width="wrap_content"
                            android:layout_height="wrap_content"
                            android:text="Python"
                            android:paddingLeft="10dp"/>

                    </LinearLayout>


                    <LinearLayout
                        android:layout_width="match_parent"
                        android:layout_height="15dp"
                        android:layout_gravity="center_vertical"
                        android:layout_marginTop="5dp">

                        <TextView
                            android:id="@+id/tvCPP"
                            android:layout_width="wrap_content"
                            android:layout_height="wrap_content"
                            android:text="C++"
                            android:paddingLeft="10dp"/>

                    </LinearLayout>

                    <LinearLayout
                        android:layout_width="match_parent"
                        android:layout_height="15dp"
                        android:layout_gravity="center_vertical"
                        android:layout_marginTop="5dp">

                        <TextView
                            android:id="@+id/tvJava"
                            android:layout_width="wrap_content"
                            android:layout_height="wrap_content"
                            android:text="Java"
                            android:paddingLeft="10dp"/>

                    </LinearLayout>

                </LinearLayout>

            </LinearLayout>

        </androidx.cardview.widget.CardView>


     </RelativeLayout>

 </androidx.constraintlayout.widget.ConstraintLayout>
Step 3: Create an MainActivity.java file in your package folder .
Implement the same invoke the following code inside MainActivity.java file.
 import android.graphics.Color;
 import android.os.Bundle;
 import android.widget.TextView;
 import androidx.appcompat.app.AppCompatActivity;
 import org.eazegraph.lib.charts.PieChart;
 import org.eazegraph.lib.models.PieModel;

 public class MainActivity extends AppCompatActivity {
    TextView tvR, tvPython, tvCPP, tvJava;
    PieChart pieChart;

    @Override
    protected void onCreate(Bundle savedInstanceState) {
        super.onCreate(savedInstanceState);
        setContentView(R.layout.activity_main_two);
        tvR = findViewById(R.id.txtR);
        tvPython = findViewById(R.id.tvPython);
        tvCPP = findViewById(R.id.tvCPP);
        tvJava = findViewById(R.id.tvJava);
        pieChart = findViewById(R.id.piechart);
        fillData();

    }

    private void fillData() {

        tvR.setText("R: 40");
        tvPython.setText("C: 30");
        tvCPP.setText("CPP: 5");
        tvJava.setText("java: 35");

        pieChart.addPieSlice(
                new PieModel(
                        "R",
                        Integer.parseInt("40"),
                        Color.parseColor("#FFA726")));
        pieChart.addPieSlice(
                new PieModel(
                        "C",
                        Integer.parseInt("30"),
                        Color.parseColor("#66BB6A")));
        pieChart.addPieSlice(
                new PieModel(
                        "C++",
                        Integer.parseInt("5"),
                        Color.parseColor("#EF5350")));
        pieChart.addPieSlice(
                new PieModel(
                        "Java",
                        Integer.parseInt("35"),
                        Color.parseColor("#29B6F6")));

        // To animate the pie chart
        pieChart.startAnimation();
     }

 }
Step 4: Output of above example .

Happy coding!